Wednesday, 15 February 2012
Trade 22 GBP/USD - 15 Feb 2012 - 25 pips loss
Tuesday, 14 February 2012
Trade 21 GBP/USD - 14 Feb 2012 - 50 pips profit
Monday, 13 February 2012
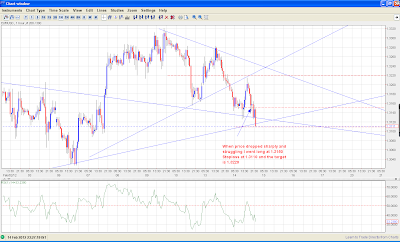
Trade 19 EUR/USD - 10 Feb 2012 - 50 profit
Still continuing to play RSI strategy, The RSI had dropped below 30 and saw candlestick reversal pattern.
Placed the limit buy even when we are at the near of weekend closure
Profit +50 pip
Lesson:
You can take RSI strategy if the setup is correct even when you are going into weekend closure.
Thursday, 9 February 2012
Trade 18 AUD/USD - 9 Feb 2012 - 50 loss
I am still continuing to play RSI level strategy. Since RSI on 1hr chart has touched 70 before dropping, I had assumed bullish trend and was looking to go long on reversal once RSI touches 40.
It happened last night and I placed limit buy order at 1.0785 with stop loss at 1.0735 (50 pips away) and the target is at 1.0870 which is channel resistance.
The point to be noted is the price had come close to 2 pips of stopping me out. This makes me think, I might need to wait further for RSI to reach 30 and look for reversal
I am stopped out on this trade for the loss of 50 pips loss.
However the point to be noticed here is the trade had gone about 35 pips in favor before reversing and stopping me out.
Lesson to be learned:
Once the trade goes to 30 pips in favor, move the stop loss to break even
Trade 17 GBP/USD - 9 Feb 2012 - 50 pips loss
Yesterday's attempt to play RSI level strategy failed with 50 pips loss. However, I was looking out for next opportunity to get into trade using the same strategy.
I read reversal signal yesterday night (marked in the chart). I placed limit buy order at 1.5810 (including spread) which is around half of the wick. The order is filled overnight.
My target is at 1.5910 i.e 100 pips. I am still in the trade.
The price had gone around 70 pip in my favour and pulled back.
Stopped out for -50 pips loss
Wednesday, 8 February 2012
Trade 16 GBP/USD - 8 Feb 2012 - Loss - 50 pips
Based on my system RSI levels, I saw candlestick reversal pattern, however the RSI had reached 50 on 1hr chart. I took this trade at RSI 50 since we are in bullish trend at 50% of the bull candle (1.5887 + 2 pips spread)
I put the stop loss at 1.5839 i.e 50 pips. I think, I have to work out on the stop loss numbers... I might not need to stick to 50 pips SL.
However, this trade ended in stopped out for 50 pips loss.
Since RSI has entered into 30s, I will look for reversal pattern and take one more shot at long...
I put the stop loss at 1.5839 i.e 50 pips. I think, I have to work out on the stop loss numbers... I might not need to stick to 50 pips SL.
However, this trade ended in stopped out for 50 pips loss.
Since RSI has entered into 30s, I will look for reversal pattern and take one more shot at long...
Tuesday, 7 February 2012
Trade 15 EUR/USD - 7 Feb 2012 - Loss 24 pips
Following my new system from RSI Level play, I entered short at 1.3150 with stoploss at 1.3200 (50 pips) and random target at 1.3075 (75 pips).
The price moved in my favor for +50 pips before reversing...
The reason being "Greece is working on final bailout document, according to Greek government official."
I have moved my stop to 1.3173, above entry point, and I am stopped out for the loss of 24 pips
Detecting early exit points
1. Today's pivot point is at 1.3096
2. Today's low and support is at 1.3095.
Based on above points, perhaps, I could have worked out something on this.
I will look to take short again reversal signal.
Subscribe to:
Posts (Atom)


