Monday, 15 October 2012

Trade 24 - GBPUSD - 12 Oct 2012

As per analysis on 10 oct 2012, we were looking to go short. I, initially, jumped into short position with 1/3 of my usual lot size at 1.6030 with stop loss 50 points at 1.6080 and target at 1.5910 and stopped out of it.

I am trying out a  new strategy here. When I opened above position, I have placed another short order at 1.6070 with stop loss @1.6120 with target @1.5910 and it got hit as writing this log.


Profit/Loss
16-Oct-2012
-50 - short @1.6030 SL@1.6080
-70 - I had opened short @1.6040 with SL 1.6110.
-50 - Short @1.6070, -> As per strategy, opened short at 1.6110
-50 - from previous short, took another dig atshort @1.6150


= -220

Wednesday, 15 February 2012

Trade 23 EUR/USD - 15 Feb 2012 - 50 pips profit

Short at 1.3165 SL - 1.3215
TP - 1.3115

Reasons for taking profit;
1. Down channel
2. RSI near to 60
3. Candlestick reversal pattern.


Trade 22 GBP/USD - 15 Feb 2012 - 25 pips loss

Short at 1.5698 SL - 1.5721
TP - 1.5648

Reasons for taking.
1. Downward channel
2. RSI touching 60
3. Candlestick reversal pattern.

1hr chart

5min chart

Tuesday, 14 February 2012

Trade 21 GBP/USD - 14 Feb 2012 - 50 pips profit

Based on RSI strategy, entered long at 1.5677, target 1.5730, stop loss 1.5627

Profit target hit.

Trade 20 EUR/USD - 14 Feb 2012 - 40 pips loss
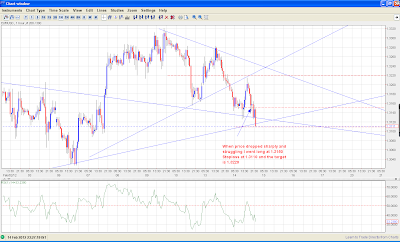
Based on the trendlines in the chart below, took long even when RSI did not dip below 30.


Monday, 13 February 2012

Trade 19 EUR/USD - 10 Feb 2012 - 50 profit

Still continuing to play RSI strategy, The RSI had dropped below 30 and saw candlestick reversal pattern.
Placed the limit buy even when we are at the near of weekend closure


Profit +50 pip

Lesson:
You can take RSI strategy if the setup is correct even when you are going into weekend closure.

Thursday, 9 February 2012

Trade 18 AUD/USD - 9 Feb 2012 - 50 loss

I am still continuing to play RSI level strategy. Since RSI on 1hr chart has touched 70 before dropping, I had assumed bullish trend and was looking to go long on reversal once RSI touches 40.
It happened last night and I placed limit buy order at 1.0785 with stop loss at 1.0735 (50 pips away) and the target is at 1.0870 which is channel resistance.


The point to be noted is the price had come close to 2 pips of stopping me out. This makes me think, I might need to wait further for RSI to reach 30 and look for reversal

I am stopped out on this trade for the loss of 50 pips loss.

However the point to be noticed here is the trade had gone about 35 pips in favor before reversing and stopping me out.

Lesson to be learned:
Once the trade goes to 30 pips in favor, move the stop loss to break even

Trade 17 GBP/USD - 9 Feb 2012 - 50 pips loss

Yesterday's attempt to play RSI level strategy failed with 50 pips loss. However, I was looking out for next opportunity to get into trade using the same strategy.

I read reversal signal yesterday night (marked in the chart). I placed limit buy order at 1.5810 (including spread) which is around half of the wick. The order is filled overnight.

My target is at 1.5910 i.e 100 pips. I am still in the trade.

The price had gone around 70 pip in my favour and pulled back.

Stopped out for -50 pips loss


Wednesday, 8 February 2012

Trade 16 GBP/USD - 8 Feb 2012 - Loss - 50 pips

Based on my system RSI levels, I saw candlestick reversal pattern, however the RSI had reached 50 on 1hr chart. I took this trade at RSI 50 since we are in bullish trend at 50% of the bull candle (1.5887 + 2 pips spread)


I put the stop loss at 1.5839 i.e 50 pips. I think, I have to work out on the stop loss numbers... I might not need to stick to 50 pips SL.

However, this trade ended in stopped out for 50 pips loss.

Since RSI has entered into 30s, I will look for reversal pattern and take one more shot at long...

Tuesday, 7 February 2012

Trade 15 EUR/USD - 7 Feb 2012 - Loss 24 pips

Following my new system from RSI Level play, I entered short at 1.3150 with stoploss at 1.3200 (50 pips) and random target at 1.3075 (75 pips).


The price moved in my favor for +50 pips before reversing...
The reason being "Greece is working on final bailout document, according to Greek government official."

I have moved my stop to 1.3173, above entry point, and I am stopped out for the loss of 24 pips


Detecting early exit points
1. Today's pivot point is at 1.3096
2. Today's low and support is at 1.3095.

Based on above points, perhaps, I could have worked out something on this.

I will look to take short again reversal signal.


Tuesday, 24 January 2012

Trade 14 EUR/USD - 25 Jan 2012


===========================>
Broke the support line today... closed the position for at 1.2997 for loss of 29 pips.

Will try to get long again at 1.2975 which is 78 % retracement and SE1 for today.

=====================================>
Entered long at 1.2987 based on 15 min chart....

stopped out again for -50 pips

Trade 13 EUR/USD - 24 Jan 2012 - Loss


Trade 12 AUS/USD - 24 Jan 2012 - Loss

When I saw the price reaching near recent low and going up, I jumped in into long at 1.0496 with stoploss 1.0444 and stopped out.

Saturday, 21 January 2012

checklist

1. Did it break or hold any trendline?
2. What are the Fibonacci extensions?
3. What do you see on RSI/MACD?
4. Are there any trendlines?
5. what are the pivot levels?
6. Lookout for news announcements.
7. What pattern do I see?

Friday, 20 January 2012

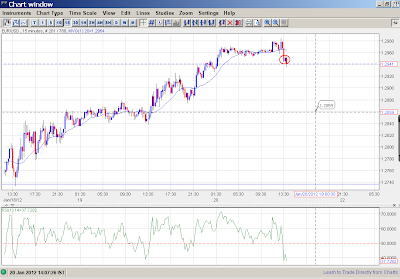
Trade 11 EUR/USD - 20 Jan 2012 - Loss

Entered long at 1.2949 on impulse when I saw the price pulled back sharply. My initial plan was to go long at around 1.2930 (near to today's pivot level) for target of 1.3000. I might regret for not controlling this impulse.


The price did not hold above today's pivot level, closed the position at 1.2908 for the loss of 42 pips.
Advice to myself: If I had waited for 1.2930 for entry, my loss would have be lesser by 20 pips.

However, seeing this break of pivot level, I have reversed my position at 1.2908 for target of 1.2880 which is today's support S1. I will close half the position and wait for further move...

By looking at the price at that level, I might try to go long, since this price movement looks to be, solely, on profit booking...

If 1.2880 breaks, I will add to my short position....

=========>
Looking at price action on 30 mins... we may no longer go down. If the price does not fall in couple of hours of NA session open, I will think of closing this position


============>
The price did not drop to 1.2880 in the time period that I had in mind. If the price drops from here, it should follow through to 1.2850. Hence cancelling the move to close half the position at 1.2880. Now, the target is 1.2850


Interesting chart at http://chart.ly/4ngp8aq


====================>
Not able decide what market is going to do....

========================>

This gets interesting...

=====================>
I shorted again here at 1.2924 to close out earlier short.... It might bomb on me... time will tell.
=====================>
Closed both the shorts since it broke out of its range....

Profit/Loss: -45 pips
Total Loss : -87 pips
Not going to take any more trades since I am winding up for the week today being Friday

============================================================
Retrospection:
1. I could have noticed that previous trendline was broken.
2. When a break out occurs, often the price retraces back to breakout point before continuing further.

Thursday, 19 January 2012

Trade 10 EUR/USD - 18 Jan 2012 - Profit

After breaking aggressively last week, the price was retracing back. I was looking to go short again.

However, the price kept on making higher lows. This made me change short term bias to bullish.
I went long at 1.2810 when I saw the price pulled back sharply after short fall. Set the stop loss at 1.2760 (50 pips) based on my risk capacity.

Set the intial target at 1.2870 which was recent high. It was met and closed half the position and moved the stoploss to break even.

Set the final target at 1.2945 which was near to Daily R1. However, closed the trade at 1.2934 early since the trade has already last for +120 pips

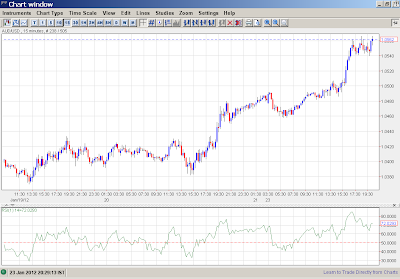
Trade 9 AUD/USD - 18 Jan 2012

AUS/USD was resilient in breaking below 1.0350 as per my previous analysis. Hence I have changed my bias to bullish for short-term until clear bear signals are received from the market.

Took first long @ 1.0367 (#1) with stop loss at 1.0317 when the price was nearing previous support on two earlier occasions. Set the initial target at recent high of 1.0420 (#2)to close half the position, which is eventually hit. 

Later, the price retrace and I opened another lot long at 1.0397 (#3) with stop loss at 1.0350 (below recent low). Set the target of 1.0430 (recent high) (#4)  to close half the position of this lot and it is eventually hit.

Now, I have moved the stoploss to 1.0367 (below recent low)

Waiting for pullback to re-enter into long....


=============================================
23 Jan 2012

The price has broken through resistance. My final target is at 1.0650 (short of 1.0700).
==========================================>>
24 Jan 2012

When the price moved up... I moved the stop loss to 1.0447 below recent low.

Profit/Loss: +50 pips

Retrospection
When I look at the price, I gave more than 100 pips profit back to market.
The question needs to be asked what could I have done to maximize the profit.

When we see 1hr chart, we see a steep uptrend trendline

As per trading rules of a trendline at http://karunakarp.blogspot.com/2012/01/trends.html,

The angle between a trendline and the  horizontal axis reflects the emotional intensity of the dominant market crowd.  The shallow trendline is likely to last longer.

Sometimes prices accelerate away from trendline. Then you can draw a new, steeper trendline. It shows that a trend is speeding up, becoming unsustainable. When you draw a new steeper trendline, tighten your stop, place it immediately below latest trendline and adjust that stop every new bar. The breaking of a steep trendline is usually followed by a sharp reversal.


I could have noticed and followed and could have maximized the profit.

Tuesday, 10 January 2012

Trade 8 EUR/USD - 10 Jan 2012

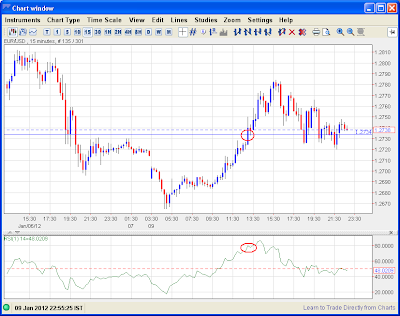
Immediately after trade Trade 7 EUR/USD - 10 Jan 2012, I saw RSI below 34 and since I had upward bias from Daily Analysis : EUR/USD - 10 Jan 2012, I took this trade to go long at 1.2753 with stop loss at recent low at 1.2719 and targeting around 12850


Updating on 18/1/2012 - Closed the trade since the price did not move to target in the desired timeframe

Profit/Loss = +1 pips

Trade 7 EUR/USD - 10 Jan 2012

I saw RSI extending beyond 60 at previous resistance. I took short position at 1.2780 with SL at 1.2805 and take profit at 1.2750. This worked out well to give 30 pips gain.


Profit/Loss : +30 pip

Monday, 9 January 2012

Trade 6 EUR/USD - 9 Jan 2012

Immediately after Trade 5 EUR/USD - 9 Jan 2012, I entered short again when I saw price dropping rapidly at 1.2748 with stoploss at 1.2798  (50 pips). I am still in the trade at the moment. Again this trade is taken on impulse. I must stop myself from taking a trade on impulse.

Date: 10 Jan 2012
The price traded above my entry level came around 2 pips close to stop me out. I had given up hope on this trade and moved the take profit back to entry level. Fortunately, the price came back to close the trade for no loss no profit.


Profit/Loss : 0 pips

Trade 5 EUR/USD - 9 Jan 2012

I used the same analysis Daily Analysis : EUR/USD - 9 Jan 2012. I entered short again at first reversal at 1.2767. However I could not hold onto the position and closed it out at 1.2782 on impulse when I saw the market rising just before the drop


Profit/Loss : -16 pips

Learning: Trust your analysis

Trade 4 EUR/USD - 9 Jan 2012

I had done the analysis as per previous day Daily Analysis : EUR/USD - 9 Jan 2012. When I looked at the market at around 1:00 PM IST, the RSI has reached about 70. Since the market is in downtrend I decided to short without waiting for any other confirmation at 1.2734 with stop loss at 1.2760. The price kept on rising to stop me out for loss of 26 pips.


Profit/Loss : -26 pips

Learning: I should have waited for confirmation before entering the trade.

Trade 3 AUS/USD 9 Jan 2012

This trade was based on analysis done at Daily Analysis : AUS/USD - 9 Jan 2012. The price broke below 1.0175. I decided to go short at 1.0157 even when I did not get short signal using RSI. I put 1.0190 which is 33 pips away from entry. The price traded up and stopped me out of the trade. As they say, first stop is the best loss.


Profit/Loss : -33 pips